Understanding $SKEW: A Key Indicator for Market Risk
What is $SKEW and Why Does It Matter?
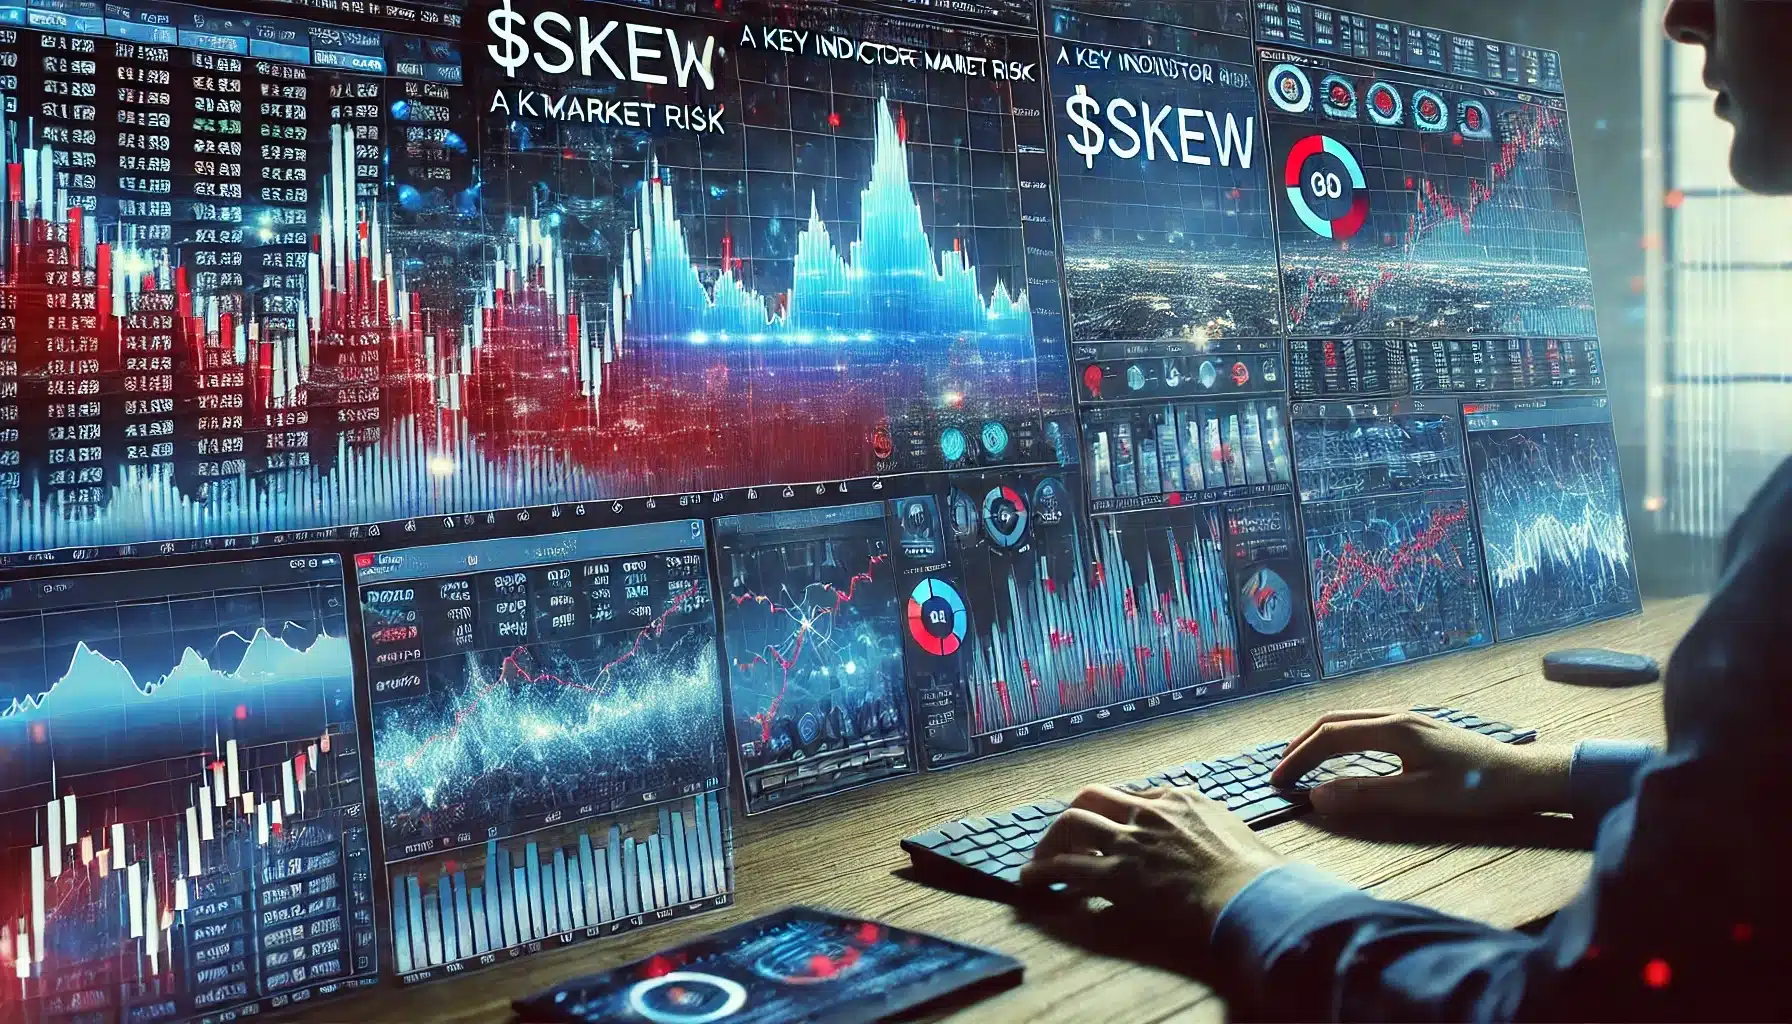
The $SKEW Index, published by the Cboe, measures the market’s perception of extreme risk events. It reflects the cost of far out-of-the-money (OTM) put options on the S&P 500. When traders expect a sudden market crash, they buy these deep OTM puts as protection, causing the $SKEW index to rise.
- Higher $SKEW = Higher perceived risk of a major market drop (more demand for crash protection).
- Lower $SKEW = Lower perceived risk of a market crash (less demand for protection).
How is $SKEW Different from the VIX?
- VIX measures overall market volatility expectations.
- $SKEW measures the probability of extreme tail-risk events.
- A high VIX means traders expect volatility soon, while a high $SKEW means traders are worried about an unexpected large move in the future.
Normal vs. Elevated $SKEW Levels
1. Normal $SKEW Levels (120-140)
At normal levels, the market is not overly fearful of a crash. Investors are hedging as usual, but there’s no major panic. This range indicates that traders believe the probability of a black swan event is relatively low.
Example:
- If $SKEW is 130, it signals a balanced market with standard hedging activity.
- Traders expect some market fluctuations, but not a major downturn.
Implication:
- No urgent need for excessive hedging.
- Market conditions are relatively stable.
- Options pricing remains within historical norms.
2. Elevated $SKEW Levels (140-150+)
When $SKEW rises above 140, it indicates increased demand for crash protection. Traders are hedging aggressively, pricing in a higher chance of a market correction.
This range suggests that institutions and large traders are paying a premium for deep OTM puts. Such positioning often aligns with concerns about upcoming macroeconomic risks, geopolitical events, or earnings season volatility.
Example:
- If $SKEW jumps to 155, traders are heavily buying deep OTM puts, fearing a major drop.
- This often happens before key economic reports (like CPI, Fed meetings) or geopolitical risks.
Implication:
- Volatility could increase.
- Traders may want to tighten risk management or hedge their portfolios.
- The cost of tail-risk protection becomes significantly higher, indicating heightened market concerns.
3. Extremely High $SKEW Levels (160+)
When $SKEW exceeds 160, it signals extreme hedging and fear. In this scenario, traders are extremely concerned about potential market crashes, leading to disproportionately high demand for tail-risk hedges.
Historically, very high $SKEW levels often do not lead to immediate crashes but rather reflect the pricing of extreme downside risk. However, sometimes the fear is exaggerated, and the market may stabilize rather than decline drastically.
Example:
- In December 2021, $SKEW hit 170, indicating a high expectation of a crash.
- However, no major crash happened, and the market stabilized.
Implication:
- The market may not crash immediately, but smart money is preparing for risk.
- Sometimes, it can be a contrarian signal—too much fear means a short-term rally may occur.
- Traders should assess other risk indicators (such as credit spreads and bond yields) before making aggressive bearish bets.
4. Low $SKEW Levels (Below 120)
When $SKEW is very low, it means traders are not buying much crash protection. While this might seem like a positive sign, it can actually be a warning of complacency.
Historically, markets tend to experience sharp volatility increases after extended periods of low $SKEW levels. When investors are too relaxed and not hedging, any unexpected event can trigger panic selling, leading to rapid corrections.
Example:
- In February 2020, before the COVID-19 crash, $SKEW was around 118.
- Because no one expected a crash, when it happened, volatility surged, and traders were caught off guard.
Implication:
- A period of low $SKEW is often followed by a sharp volatility spike.
- This may be a good time to buy cheap hedges, like OTM puts or VIX calls.
- Traders should watch for changes in economic conditions that could unexpectedly shake investor confidence.
How Traders Can Use $SKEW
1. Trading During Elevated $SKEW (Above 140-150)
✅ What to do:
- Consider selling expensive OTM puts (as they might be overpriced).
- Hedge your portfolio using VIX calls or SPX put spreads.
- Reduce leverage and be cautious with aggressive long positions.
- Monitor news catalysts that may be driving risk perceptions higher.
2. Trading During Low $SKEW (Below 120-125)
✅ What to do:
- Buy OTM puts while they’re cheap (downside risk may be underpriced).
- Be cautious of market complacency—it often leads to unexpected corrections.
- If other risk indicators (like credit markets or bond yields) also suggest complacency, be more defensive.
3. Trading When $SKEW is Normal (120-140)
✅ What to do:
- Trade normally with standard risk management.
- No extreme risk signals—markets are functioning in a typical manner.
- Focus on directional trades rather than extreme volatility hedges.
Frequently Asked Questions (FAQs)
1. What is a good $SKEW level for a stable market?
A $SKEW level between 120-140 is considered normal and suggests a balanced market without excessive fear or complacency.
2. How does $SKEW impact options pricing?
A higher $SKEW indicates that deep OTM puts are more expensive, meaning traders are willing to pay a premium for crash protection. A lower $SKEW means tail-risk options are cheaper.
3. Can a high $SKEW predict a market crash?
Not necessarily. A high $SKEW means traders are hedging against a potential crash, but it does not guarantee one. Sometimes, markets remain stable despite high $SKEW readings.
4. Is a low $SKEW a bullish signal?
Not always. A low $SKEW can indicate complacency, which may lead to unexpected volatility spikes if a sudden negative event occurs.
5. How should traders use $SKEW in trading strategies?
Traders should monitor $SKEW alongside other indicators like the VIX, credit spreads, and market sentiment to make informed decisions about hedging and risk exposure.
Conclusion
- Normal $SKEW (120-140): Balanced market, normal risk expectations.
- Elevated $SKEW (140-160): Market hedging against a crash—volatility may rise.
- Very High $SKEW (160+): Extreme fear—tail risk is being aggressively priced in.
- Low $SKEW (<120): Traders are too relaxed—watch out for unexpected market moves.
By tracking $SKEW, traders can anticipate potential risk events, hedge accordingly, and make better-informed trading decisions. Monitoring $SKEW alongside other indicators such as the VIX, credit spreads, and economic data allows traders to assess market risk sentiment with greater accuracy.
Check out articles on:
- Introducing to Options Trading
- Mastering Butterfly Spreads
- The Power of Diagonal Spreads
- The Power of Iron Condors
- The Power of Vertical Credit Spreads
- How to Succeed Trading Stocks, and Stock Options in a Volatile Market
Elevate Your Options Trading Skills
Ready to master options? Join our community for in-depth education on options trading, live sessions, and expert analysis of options trading strategies. Sign up today to start profiting from market swings using advanced options trading strategies!
Below are the links:
- Day Trading Room
- Swing Trading Room(Short-term)
- Small Account Mentorship
- SPX Trading Alerts(Alerts Only)
- Revolution Swings(Alerts Only)
To your success,
Billy Ribeiro is a globally recognized trader renowned for his mastery of price action analysis and innovative trading strategies. He was personally mentored by Mark McGoldrick, famously known as “Goldfinger,” Goldman Sach’s most successful investor in history. McGoldrick described Billy Ribeiro as “The Future of Trading,” a testament to his extraordinary talent. Billy Ribeiro solidified his reputation by accurately calling the Covid crash bottom, the 2022 market top, and the reversal that followed, all with remarkable precision. His groundbreaking system, “The Move Prior to The Move,” enables him to anticipate market trends with unmatched accuracy, establishing him as a true pioneer in the trading world.
Connect with us: