| Index Name | Thinkorswim Ticker Symbol | Country/Region | Description |
|---|---|---|---|
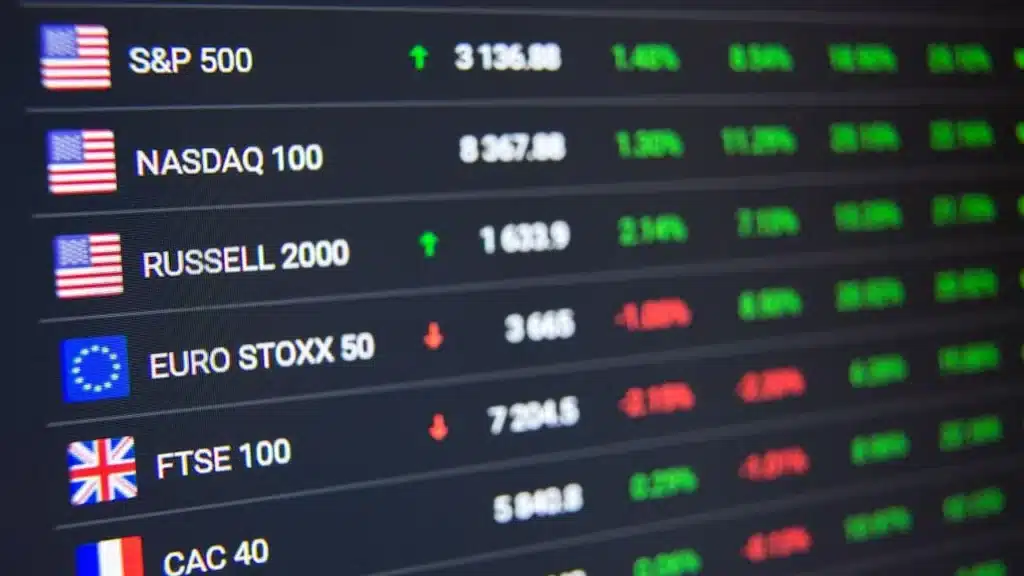
| S&P 500 | $SPX | United States | Tracks 500 of the largest publicly traded companies in the U.S. |
| Dow Jones Industrial Average | $DJI | United States | Tracks 30 large, publicly-owned companies trading on the NYSE and NASDAQ |
| Nasdaq Composite | COMPQ | United States | Tracks all stocks listed on the Nasdaq stock exchange, heavily weighted toward technology companies |
| Russell 2000 | $RUT | United States | Tracks 2,000 small-cap companies in the U.S. |
| Wilshire 5000 | $W5000 | United States | Tracks all publicly traded companies in the U.S., often referred to as the "total market index" |
| FTSE 100 | $FTSE | United Kingdom | Tracks 100 of the largest companies listed on the London Stock Exchange |
| DAX | $DAX | Germany | Tracks 40 major German companies trading on the Frankfurt Stock Exchange |
| CAC 40 | $CACX | France | Tracks 40 of the largest companies listed on the Paris Bourse |
| Euro Stoxx 50 | $STOXX50E | Eurozone | Tracks 50 of the largest and most liquid stocks in the Eurozone |
| Nikkei 225 | $N225 | Japan | Tracks 225 of the largest companies listed on the Tokyo Stock Exchange |
| Hang Seng Index | $HSI | Hong Kong | Tracks the largest companies listed in Hong Kong |
| Shanghai Composite | $SSEC | China | Tracks all stocks listed on the Shanghai Stock Exchange |
| SSE 50 | $SSE50 | China | Tracks the 50 most representative stocks listed on the Shanghai Stock Exchange |
| KOSPI | $KOSPI | South Korea | Tracks all common stocks traded on the Korea Exchange |
| S&P/ASX 200 | $ASX | Australia | Tracks 200 of the largest companies listed on the Australian Securities Exchange |
| BSE Sensex | $BSESN | India | Tracks 30 of the largest, most actively traded stocks on the Bombay Stock Exchange |
| Nifty 50 | $CNX | India | Tracks 50 of the largest Indian companies listed on the National Stock Exchange |
| IBEX 35 | $IBEX | Spain | Tracks 35 of the most liquid Spanish stocks listed on the Madrid Stock Exchange |
| TSX Composite | $TSX | Canada | Tracks approximately 250 of the largest companies listed on the Toronto Stock Exchange |
| Bovespa Index | $BVSP | Brazil | Tracks around 60 of the most actively traded stocks on the B3 (Brazil Stock Exchange) |
| RTS Index | $RTSI | Russia | Tracks 50 of the most liquid Russian stocks, denominated in USD |
| MSCI World Index | $MSCWI | Global | Tracks over 1,600 stocks from 23 developed countries |
| MSCI Emerging Markets Index | $MSCIE | Emerging Markets | Tracks stocks from 26 emerging market countries |
| VIX (Volatility Index) | $VIX | United States | Measures the market's expectation of 30-day volatility derived from S&P 500 index options |
| Stoxx Europe 600 | $SXXP | Europe | Tracks 600 companies across 18 European countries, representing a broad cross-section of European stocks |
The S&P 500 is a prominent stock index that tracks the 500 largest companies listed on major U.S. exchanges, such as the NYSE and NASDAQ. This index is weighted based on the total market capitalization of each company’s outstanding shares, which means it offers a comprehensive representation of the overall U.S. stock market, more so than other indexes like the Dow Jones Industrial Average (DJIA) or the Russell 2000.
Recognized globally as one of the most influential stock indexes, the S&P 500 is market capitalization-weighted. This indicates that companies with larger market values have a more significant impact on the index’s overall performance compared to smaller companies. In essence, bigger companies exert more influence over the market’s overall movement. Therefore, investors aiming for exposure to large-cap stocks (such as Apple or Microsoft) might find it beneficial to invest in ETFs like VOO or IVV rather than picking individual stocks for their portfolio.
To closely monitor market trends, $SPY and $ES are commonly used instruments. Having a chart of either SPY or SPY futures is crucial when trading stocks, as the majority of stocks tend to move in tandem with the broader market.
A stock allows investors partial ownership in a company. An index gives investors the option of investing in a basket of companies.
An index cannot be traded or invested in directly. Many different products, such as ETFs, mutual funds, and derivatives, are available to investors.
The most widely cited US stock market index is the S&P 500, which measures 500 large-cap stocks.