How to Spot and Trade Trend Reversals

Billy Ribeiro

Billy Ribeiro

Founder and Head Trader

Table of Contents

How to Spot and Trade Trend Reversals

A Comprehensive Guide for Traders

In the dynamic world of financial markets, identifying trend reversals is a crucial skill that can significantly impact your trading success. Whether you’re a novice trader or a seasoned professional, understanding how to spot and capitalize on these pivotal market shifts can be the difference between substantial profits and costly losses. This comprehensive guide will walk you through ten essential strategies to master the art of trading trend reversals.

How to Spot and Trade a Trend Reversal

1. Understanding Market Structure

Before diving into specific reversal patterns, it’s crucial to grasp the basic structure of market trends. This foundational knowledge will serve as the bedrock for identifying potential reversals.

Key Components of Market Structure:

  • Uptrends: Characterized by higher highs and higher lows
  • Downtrends: Identified by lower highs and lower lows
  • Ranging markets: Exhibit relatively equal highs and lows

Understanding these structures allows you to contextualize price movements and identify when a trend might be losing steam or reversing.

Pro tip: Always consider the larger time frame trend when looking for reversals on shorter time frames. A reversal on a 5-minute chart may just be noise in a larger uptrend on the daily chart.

2. Candlestick Reversal Patterns

Candlestick charts offer a wealth of information about market psychology and can signal potential trend reversals. Learning to recognize these patterns can give you a significant edge in predicting market turns.

Common Reversal Candlestick Patterns:

  1. Hammer and Inverted Hammer: Single-candle patterns that can signal a potential bottom in a downtrend
  2. Engulfing patterns (Bullish and Bearish): Two-candle patterns where the second candle completely engulfs the first, suggesting a strong shift in momentum
  3. Morning Star and Evening Star: Three-candle patterns that can signal the end of a trend and the beginning of a reversal
  4. Doji: Represents indecision in the market and can signal a potential reversal when appearing at the end of a strong trend

3. Technical Indicators for Trend Reversals

While no single indicator is foolproof, combining multiple technical indicators can provide strong reversal signals. These tools can help confirm what you’re seeing in price action and candlestick patterns.

Key Technical Indicators:

  • Relative Strength Index (RSI): Measures the speed and change of price movements. Overbought or oversold conditions can signal potential reversals.
  • Moving Average Convergence Divergence (MACD): Shows the relationship between two moving averages of a price. A MACD crossover can signal a trend reversal.
  • Stochastic Oscillator: Compares a closing price to its price range over a specific period. Like RSI, it can indicate overbought or oversold conditions.
  • Bollinger Bands: Consist of a middle band with two outer bands. Price touching or breaking through these bands can signal potential reversals.

Research tip: Experiment with different indicator settings to find what works best for your trading style and the assets you trade. For example, adjusting the periods on your RSI can make it more or less sensitive to price changes.

4. Price Action Analysis

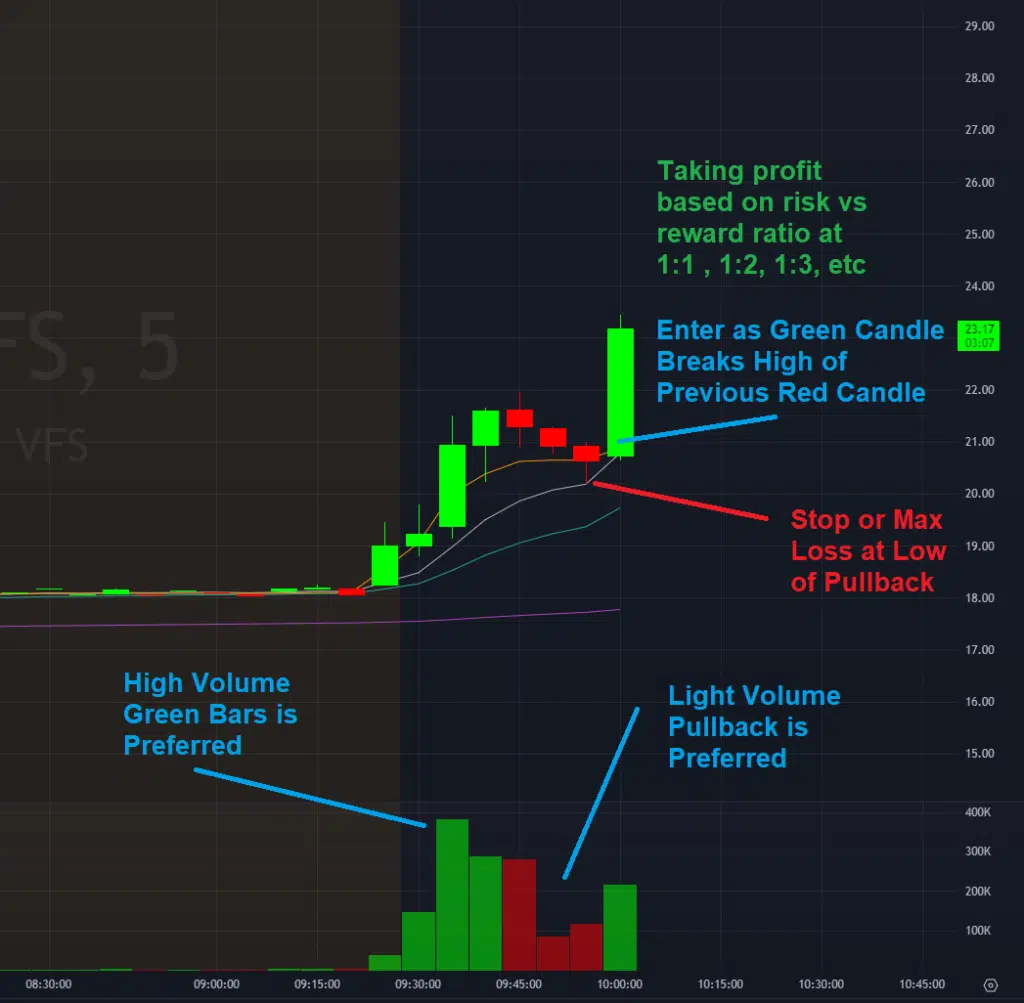
Price action trading focuses on the asset’s price movements without relying heavily on indicators. This pure form of technical analysis can be powerful for identifying trend reversals.

Price Action Reversal Signals:

  • Double tops and double bottoms: These patterns suggest that a trend has failed to continue and may be reversing.
  • Head and shoulders patterns: A reliable reversal pattern consisting of three peaks, with the middle peak (head) being the highest.
  • Wedges and triangles: These consolidation patterns can often precede powerful breakouts and trend reversals.
  • Breakouts from key support or resistance levels: A strong move through a well-established support or resistance level can signal a trend reversal.

Understanding these patterns allows you to make trading decisions based solely on price movements, cutting through the noise that can sometimes come with multiple indicators.

5. Volume Analysis

Volume is often referred to as the fuel of the market. It can provide crucial confirmation of trend reversals, as significant price moves should be accompanied by increased volume.

Volume-Based Reversal Signs:

  1. Volume spikes at potential reversal points: A sudden increase in volume at a support or resistance level can indicate a potential reversal.
  2. Declining volume in the current trend: If volume is decreasing as a trend continues, it may suggest that the trend is losing momentum and could reverse.
  3. Increasing volume as the new trend establishes: Strong volume as a new trend begins can confirm that the reversal is legitimate and likely to continue.

6. Divergences

Divergences between price action and technical indicators can signal potential trend reversals. These occur when the price of an asset moves in the opposite direction of a technical indicator.

Types of Divergences:

  • Regular divergence: Occurs when the price makes a higher high, but the indicator makes a lower high (bearish divergence) or vice versa (bullish divergence).
  • Hidden divergence: The opposite of regular divergence, hidden divergences can signal a continuation of the current trend.
  • Exaggerated divergence: An extreme form of regular divergence where the indicator and price move sharply in opposite directions.

Pro tip: Look for divergences on multiple time frames for stronger reversal signals. A divergence on both the daily and 4-hour charts is more significant than one on a single time frame.

7. Market Sentiment Analysis

Understanding market sentiment can help you anticipate potential trend reversals before they occur in price action. Sentiment often shifts before price does, making it a valuable tool for forward-looking traders.

Sentiment Analysis Tools:

  • Put/Call ratio: A high put/call ratio can indicate excessive bearishness, which might precede a bullish reversal.
  • VIX (Volatility Index): Often called the “fear index,” extreme readings on the VIX can signal potential market turns.
  • Commitment of Traders (COT) report: This weekly report shows the positions of different types of traders. Extreme positioning can often precede reversals.

By gauging market sentiment, you can position yourself ahead of the crowd and potentially enter trades before the reversal is obvious to the majority of market participants.

8. Fundamental Analysis for Reversals

While technical analysis is crucial, fundamental factors often drive significant trend reversals. Keeping an eye on these factors can help you anticipate and confirm trend changes.

Key Fundamental Factors:

  • Economic data releases: Surprises in GDP, employment numbers, inflation data, and other economic indicators can trigger trend reversals.
  • Central bank policies: Changes in interest rates or monetary policy can have far-reaching effects on market trends.
  • Geopolitical events: Wars, trade disputes, elections, and other geopolitical factors can cause abrupt trend reversals.
  • Sector-specific news: Earnings reports, regulatory changes, or technological breakthroughs can reverse trends in specific stocks or sectors.

Combining fundamental analysis with technical indicators can provide a more comprehensive view of potential trend reversals, allowing you to make more informed trading decisions.

9. Time Frame Correlation

Analyzing multiple time frames can provide a more comprehensive view of potential trend reversals. This approach helps you understand the larger context of market movements and identify more reliable reversal signals.

Multi-Time Frame Analysis Steps:

  1. Identify the trend on higher time frames: Start with a weekly or daily chart to understand the overall market direction.
  2. Look for reversal signals on lower time frames: Once you’ve identified the larger trend, zoom in to hourly or 15-minute charts to spot potential reversal signals.
  3. Confirm reversals across multiple time frames: A reversal signal that aligns across different time frames is generally more reliable than one that appears on a single time frame.

This approach helps you avoid false signals and ensures that you’re trading in line with the larger market trend.

10. Risk Management in Reversal Trades

Proper risk management is crucial when trading trend reversals, as false signals can lead to significant losses. Implementing robust risk management strategies can help protect your capital and improve your long-term trading results.

Risk Management Strategies:

  • Use appropriate position sizing: Never risk more than a small percentage of your trading capital on a single trade.
  • Set clear stop-loss levels: Always have a predetermined exit point if the trade moves against you.
  • Consider scaling into positions: Instead of entering a full position at once, consider entering in parts as the reversal confirms itself.
  • Take partial profits as the new trend establishes: This allows you to lock in some gains while letting the rest of your position potentially capture a larger move.

Conclusion

Mastering the art of spotting and trading trend reversals can significantly enhance your trading performance. By combining technical analysis, fundamental insights, and robust risk management, you can increase your chances of successfully capitalizing on these powerful market moves.

Remember, consistent practice and continuous learning are key to refining your skills in identifying trend reversals. No single strategy works in all market conditions, so it’s important to develop a flexible approach and adapt your tactics as market conditions evolve.

We’d love to hear about your experiences with trading trend reversals! Share your favorite strategies, challenges, or questions in the comments below. Together, we can navigate the complex world of financial markets and become more proficient traders.

Check out our articles on:

Elevate Your Options Trading Skills

Ready to master trading options? Join our community for in-depth education on options trading, live trading sessions, and expert analysis of  options trading strategies. Sign up today to start profiting from market swings using advanced options trading strategies!

Below are the links:


To your success,

Main Signature

Billy Ribeiro is a renowned name in the world of financial trading, particularly for his exceptional skills in options day trading and swing trading. His unique ability to interpret price action has catapulted him to global fame, earning him the recognition of being one of the finest price action readers worldwide. His deep comprehension of the nuances of the market, coupled with his unparalleled trading acumen, are widely regarded as second to none.

Connect with us:

Revolution Trading Pros


Close